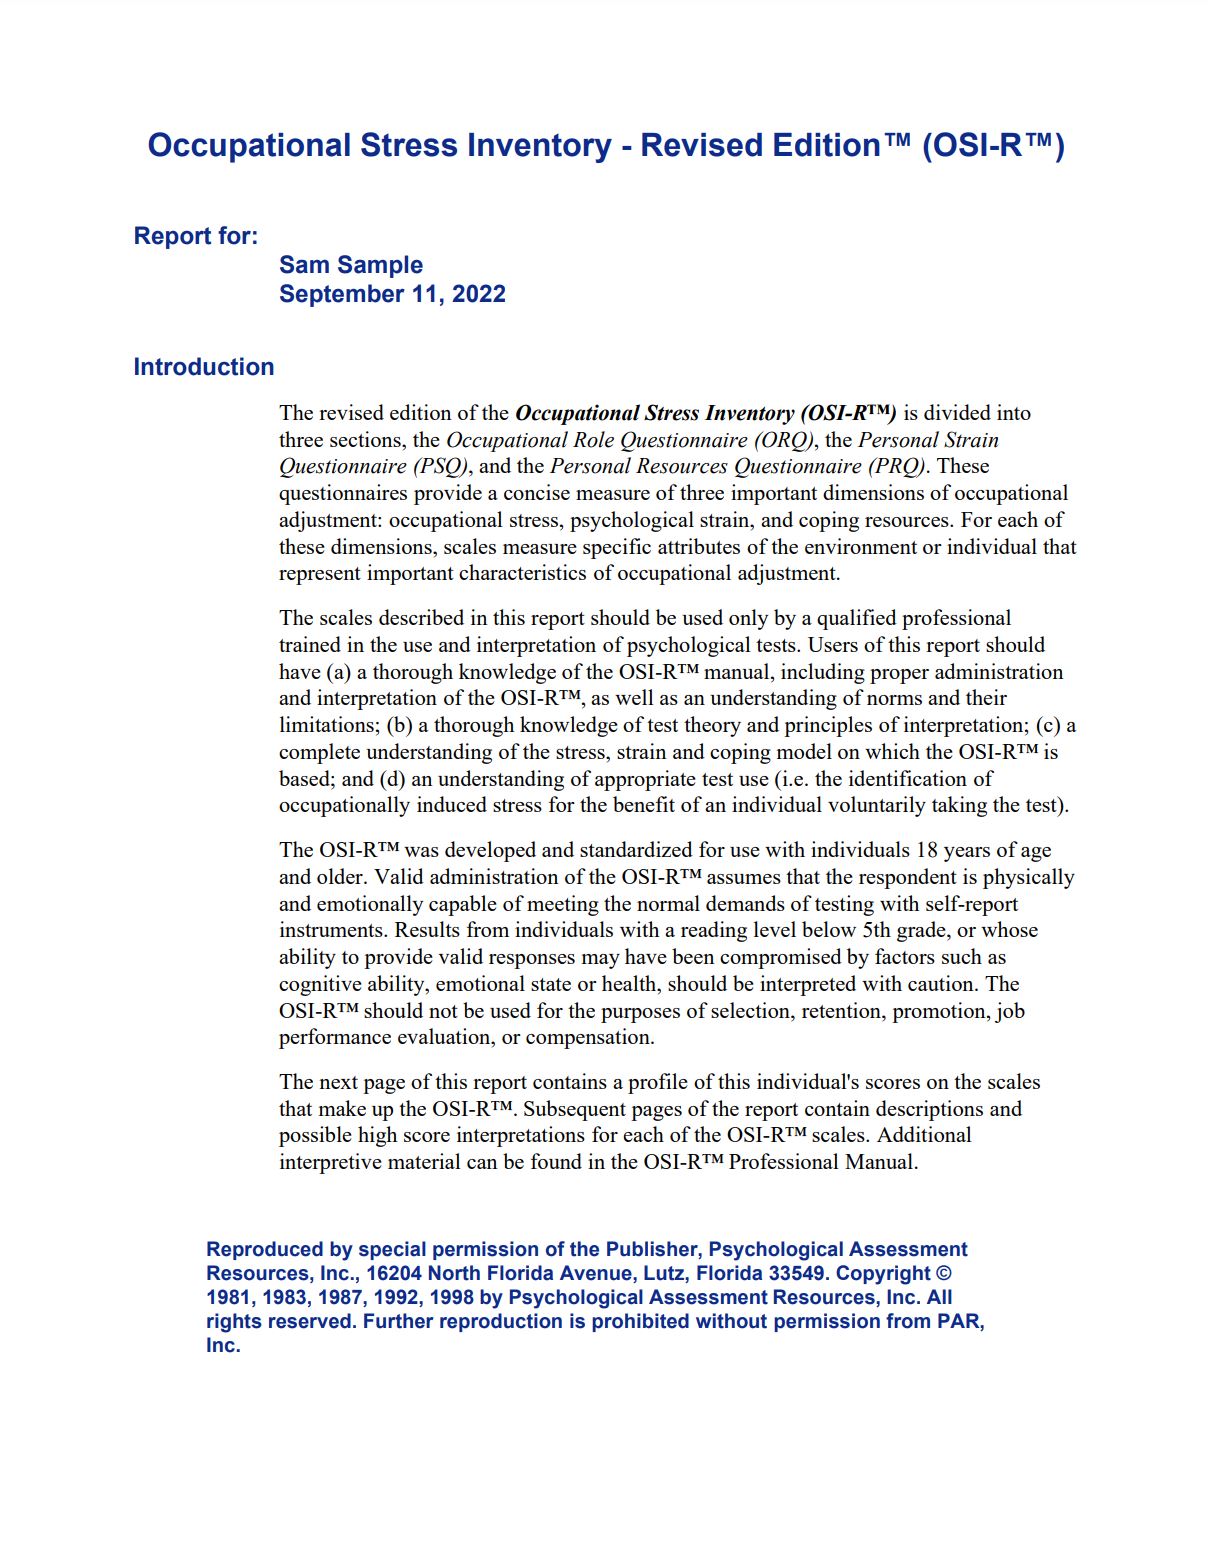
The revised edition of the Occupational Stress Inventory (OSI-R™) is divided into three sections, the Occupational Role Questionnaire (ORQ), the Personal Strain Questionnaire (PSQ), and the Personal Resources Questionnaire (PRQ). These questionnaires provide a concise measure of three important dimensions of occupational adjustment:
- occupational stress
- psychological strain
- coping resources
For each of these dimensions, scales measure specific attributes of the environment or individual that represent important characteristics of occupational adjustment.
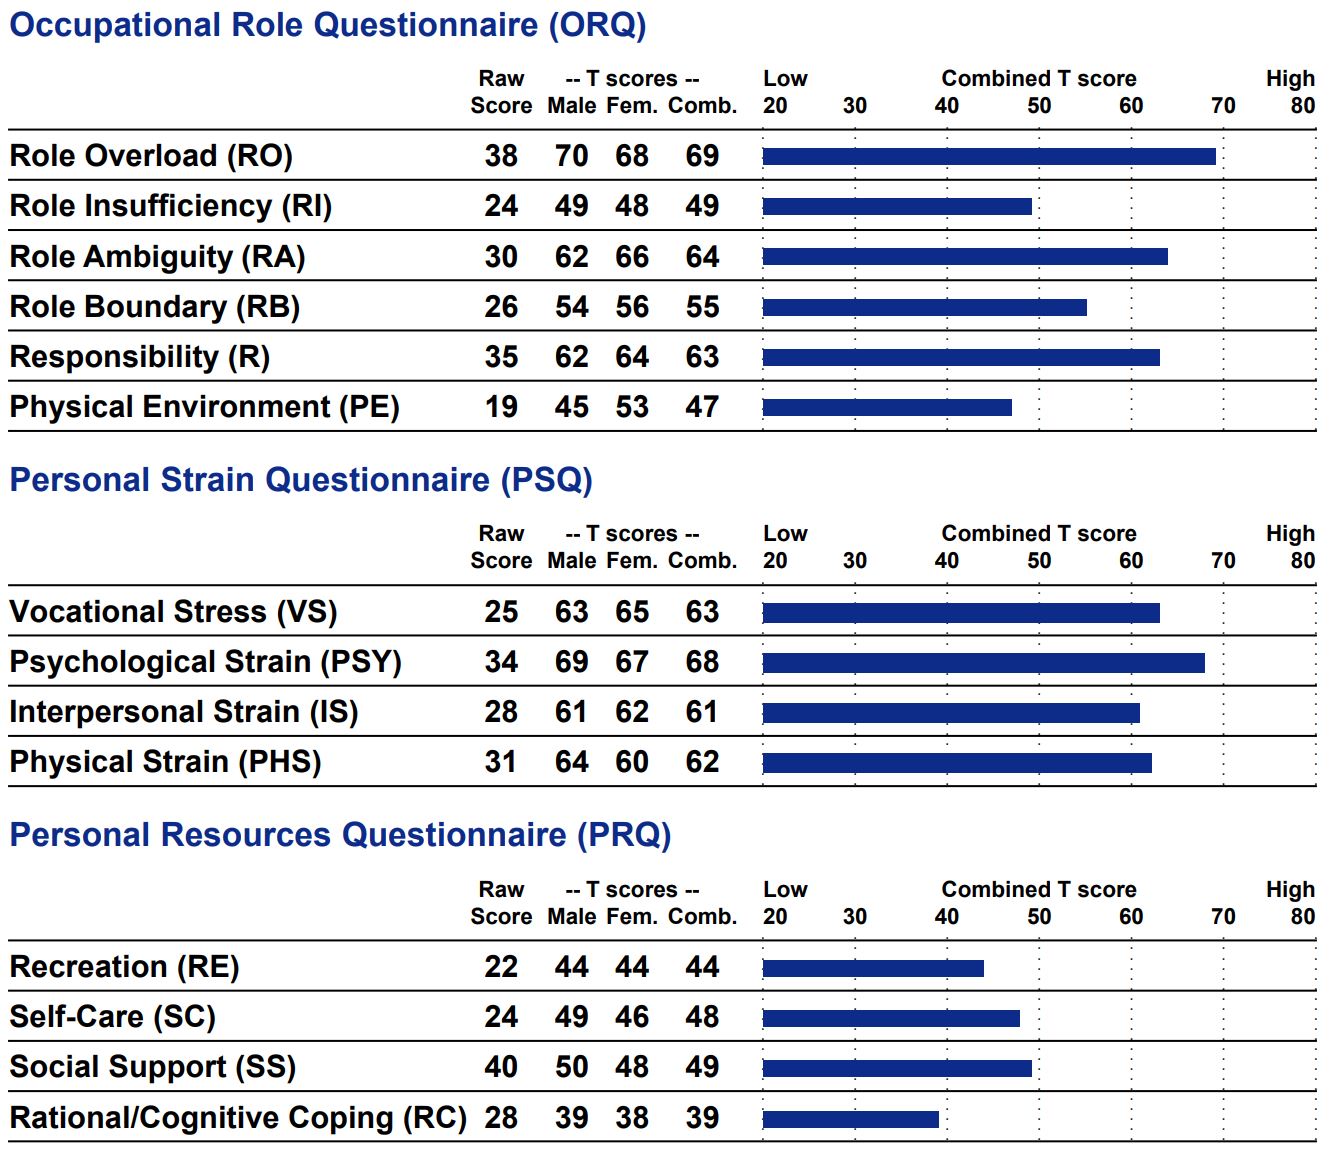
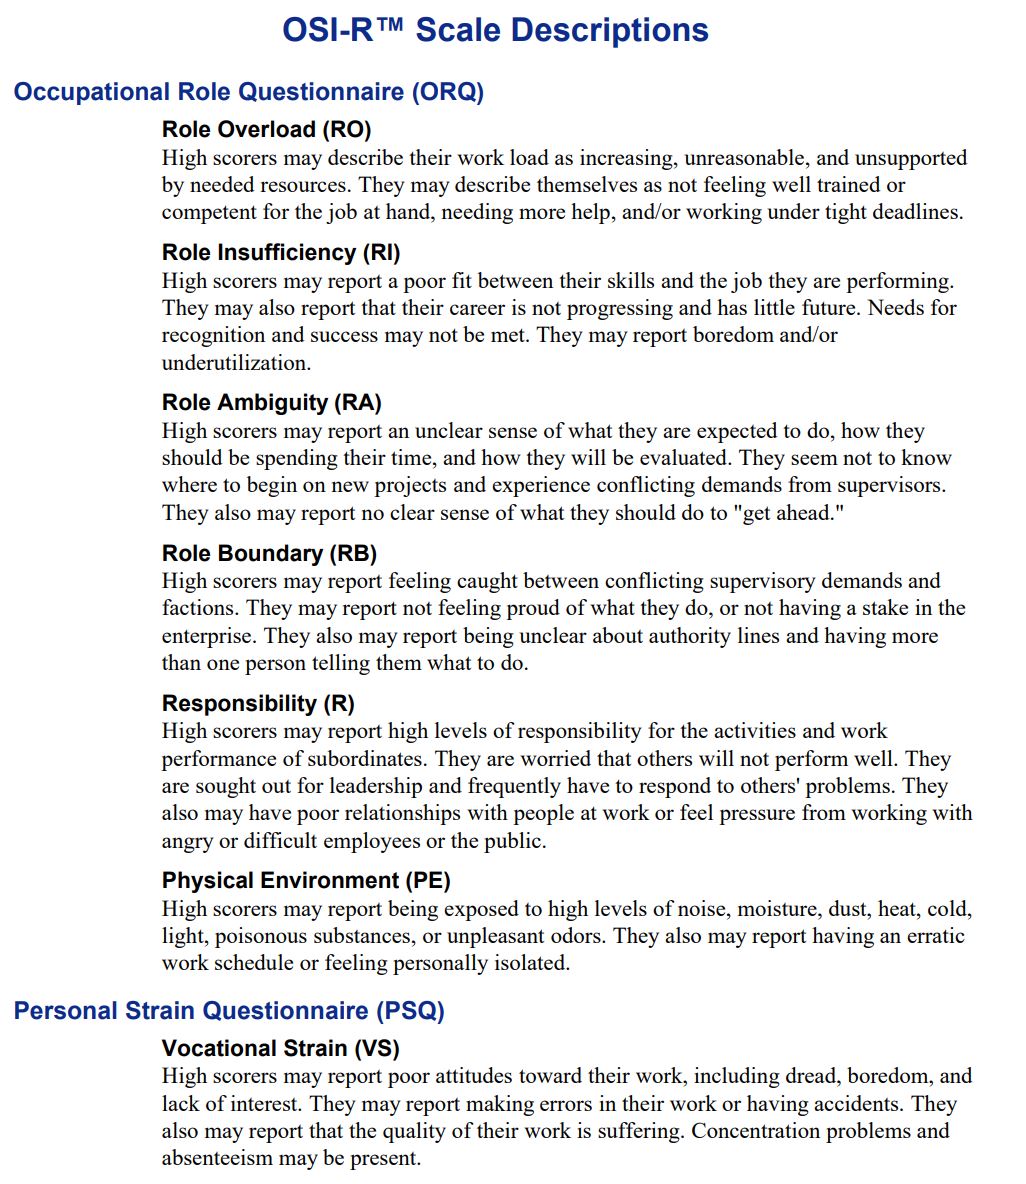
This report contains a profile of an individual’s scores on the scales that make up the OSI-R™. Subsequent pages of the report contain descriptions and possible high score interpretations for each of the OSI-R™ scales.

OSI-R Report Contents
- Page 2 – OSI-R Profile
- Page 3 – OSI-R Scale Descriptions

OSI-R™ Profile Description
The charts list the raw scores for each of the OSI-R™ scales, followed by standardized T scores that first compare the scores to those of the males in the main OSI-R™ normative sample, then the females in the normative sample, and finally to the entire combined normative sample. The combined T scores are also graphed. T scores are linear transformations of raw scores, derived to have a mean of 50 and a standard deviation of 10.
Interpretation of T Scores
For the ORQ and PSQ scales, high scores suggest significant levels of occupational stress and psychological strain, respectively.
- T scores at or above 70 indicate a strong probability of maladaptive stress, debilitating strain, or both.
- Scores in the range of 60-69 suggest mild levels of maladaptive stress and strain.
- Scores in the range of 40-59 are within one standard deviation of the mean and should be interpreted as being within normal range.
- Scores below 40 indicate a relative absence of occupational stress or psychological strain.
For the PRQ scales, high scores indicate highly developed coping resources. For these scales:
- T scores below 30 indicate a significant lack of coping resources.
- Scores in the range of 30-39 suggest mild deficits in coping skills.
- Scores in the range of 40-49 indicate average coping resources, whereas higher scores indicate increasingly strong coping resources.

The scales described in this report should be used only by a qualified professional trained in the use and interpretation of psychological tests. Users of this report should have:
a) a thorough knowledge of the OSI-R™ manual, including proper administration and interpretation of the OSI-R™, as well as an understanding of norms and their limitations;
b) a thorough knowledge of test theory and principles of interpretation;
c) a complete understanding of the stress, strain and coping model on which the OSI-R™ is based; and
d) an understanding of appropriate test use (i.e. the identification of occupationally induced stress for the benefit of an individual voluntarily taking the test).
Measure Occupational Stress in Your Organization with the OSI-R Assessment
To gain access to a customized version of this report and more, order the OSI-R assessment online today or contact us to find out more about our leadership development assessments.